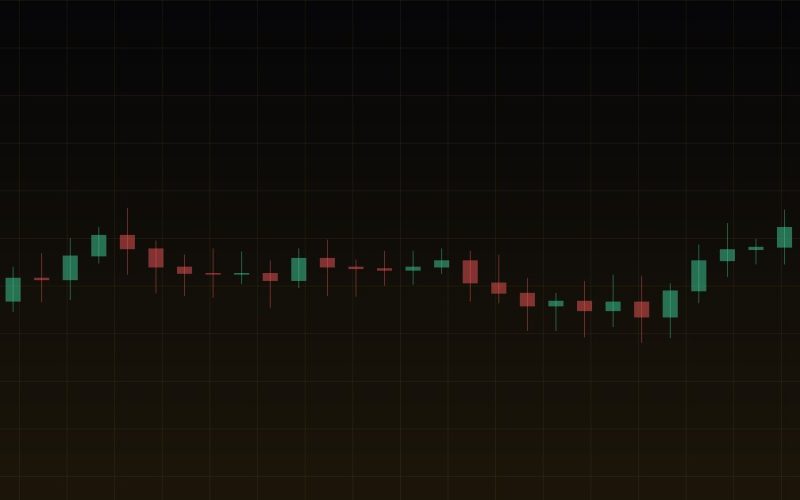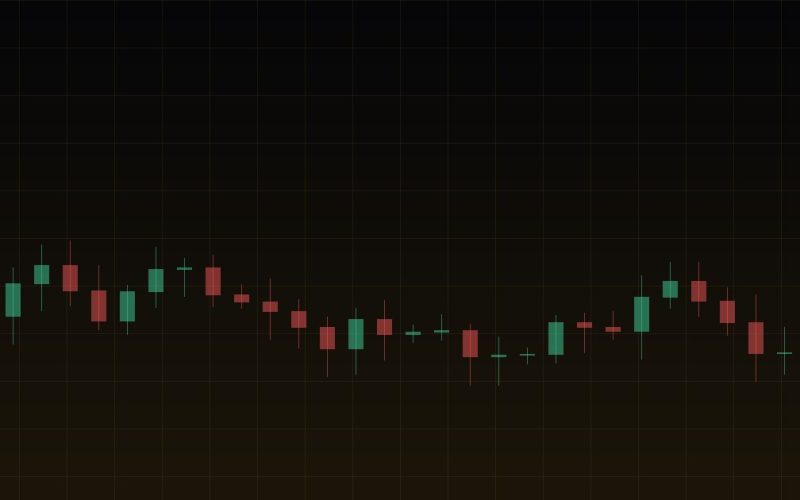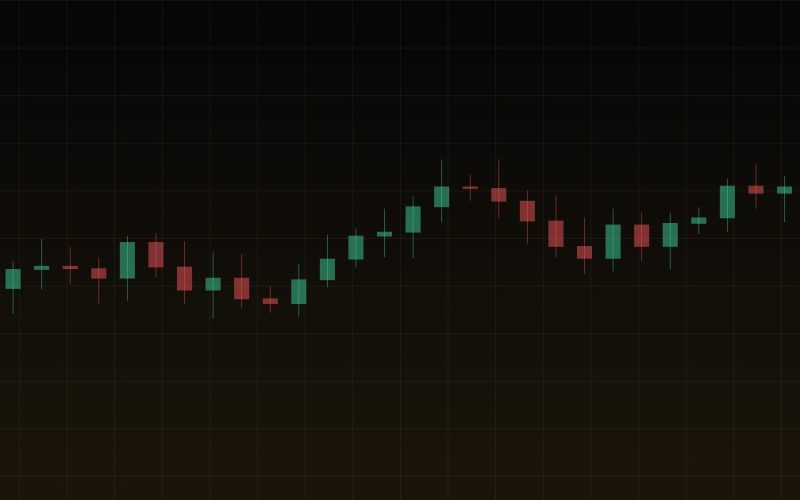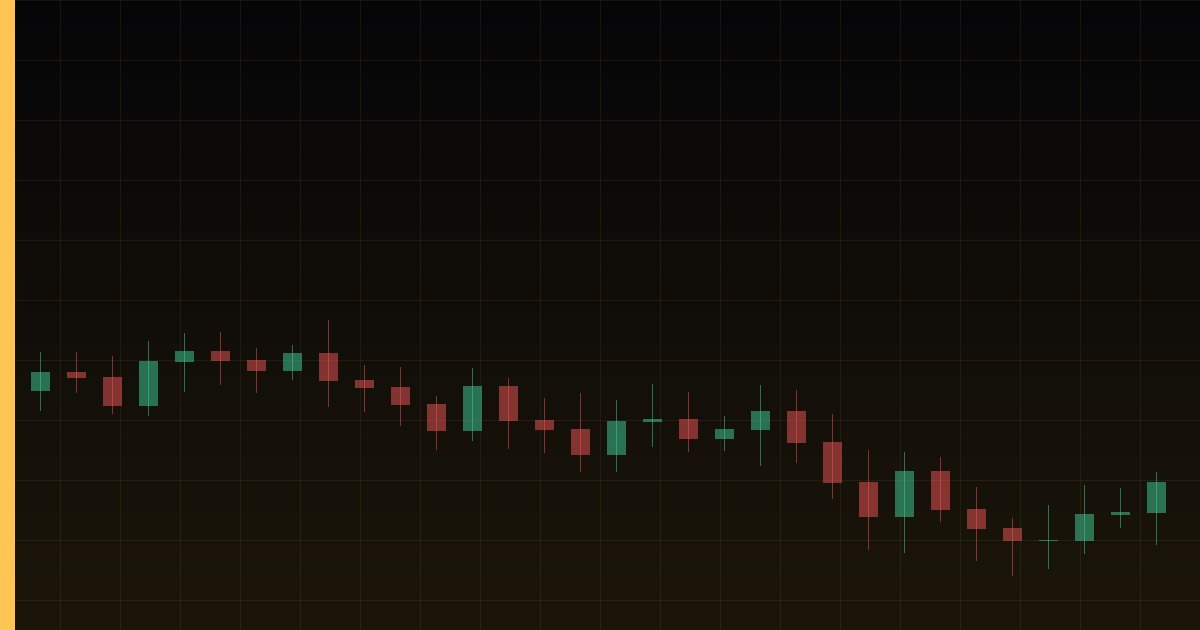
XRP fell to about $1.16 after breaking a crucial support band, and selling pressure continues to dominate on both the daily and four‑hour timeframes. The breakdown has opened the path toward the next demand region around $1.09‑$1.14.
Key takeaways
- Price broke below the $1.24‑$1.28 support zone and is now testing $1.16.
- The next significant buying area lies between $1.09 and $1.14, coinciding with the base of August’s rally.
- A sustained move under $1.09 would expose the broader $0.99‑$1.03 zone near the August lows.
- Recovery requires reclaiming the $1.18‑$1.20 lower‑high region and then the former $1.24‑$1.28 resistance.
Daily chart outlook
The daily structure remains bearish. A rejection at the $1.30‑$1.34 supply zone triggered a breakdown beneath the $1.24‑$1.28 support area, producing a series of bearish candles that pushed price toward $1.16. The next notable demand zone sits around $1.09‑$1.14, which matches the base of August’s strong advance. If that zone fails, the broader $0.99‑$1.03 region near the August lows becomes the next target. On the upside, the broken $1.24‑$1.28 band now acts as resistance; reclaiming it would ease immediate downside pressure, though the $1.30‑$1.34 supply zone remains the larger barrier to a structural improvement.
Four‑hour chart dynamics
On the four‑hour view, a breakout attempt above the descending channel’s upper boundary failed. Price briefly entered the $1.30‑$1.34 supply zone before reversing sharply, falling back inside the channel and breaking the consolidation base near $1.25. The ensuing sequence of lower highs and lower lows confirms strong bearish momentum. Currently the market is consolidating narrowly around $1.16, but this pause has not yet produced a bullish structure shift. The immediate downside reference is the $1.15 low, followed by the $1.09‑$1.14 demand zone. The channel’s lower boundary runs near $1.12, adding technical confluence within that area.
Critical price zones
Key levels to monitor include the $1.15 low as the nearest support, the $1.09‑$1.14 demand zone reinforced by the channel’s lower boundary at $1.12, and the $1.18‑$1.20 lower‑high region that must be cleared for any rebound. Above that, the former $1.24‑$1.28 support turned resistance and the $1.30‑$1.34 supply zone represent the next hurdles for a sustained recovery.
What this means for traders
Watch for a bounce at the $1.09‑$1.14 demand area; a decisive break below $1.09 would signal a deeper decline toward the $0.99‑$1.03 zone. Conversely, a sustained move above the recent lower highs near $1.18‑$1.20, followed by reclaiming the $1.24‑$1.28 region, would be required to shift the short‑term bias toward recovery. Until such price action occurs, the prevailing momentum remains bearish.
Frequently asked questions
What is the current support level for XRP?
The next major demand area is around $1.09‑$1.14, with a deeper support zone near $0.99‑$1.03 if that breaks.
Why are sellers still in control of XRP?
Both the daily and four‑hour charts show a series of lower highs and lower lows, and a recent breakout attempt failed, keeping momentum bearish.
What would signal a potential recovery for XRP?
A sustained move above the recent lower highs near $1.18‑$1.20, followed by reclaiming the $1.24‑$1.28 region, would be needed for a meaningful rebound.
Source: CryptoPotato
Get live signals and free trading courses in the ForexMentor app for Windows. Download the app
Crypto assets are highly volatile, and new tokens that have not been officially recognised are not reliable until they are. This article reports the news and is not financial advice. The decision is yours.